BED LEVEL MEASUREMENTS

AUTOMATIC MUD-DIVER, BED LEVEL MEASUREMENT & TANK PROFILING
SYSTEM FOR CLARIFIERS, THICKENERS & CCD’S
The SMARTDIVER® Advantage
Enhance Overflow Clarity
Increase Underflow Density
Superior Rake Torque Control
Optimise Flocculants consumption
Avoid Negative Events (Rake Bogging) & Increase availability of Thickener
IMPROVE THICKENER UNDERFLOW PERFORMANCE & FLOCCULATION CONTROL.
MEASURES
Bed Levels
(Mud & Interface)
Settling Zones
Overflow Clarity
Tank Profiling
(suspended solids vs depth)
Overflow Liquor
Concentration
EQUIPPED WITH THIS DATA, OPERATORS CAN OPTIMISE FLOCCULATION & CONTROL UNDERFLOW DENSITY.

HOW IT WORKS
APPLICATION
A SERIOUSLY RUGGED MEASUREMENT SYSTEM FOR A
SERIOUSLY RUGGED INDUSTRY
Designed for the Mineral Processing Sector
SmartDiver® are being used in Alumina, Nickel, Copper, Uranium, Mineral Sands, and Gold Processing facilities.
Ideal for Solid-Liquid Separation Thickeners.

Effective for Direct Air Capture (DAC), Carbon Dioxide Removal (CDR) & Carbon Capture Thickeners.
SMARTDIVER® DATA ACQUISITION EXAMPLES

The Data acquired from a SmartDiver® will help in consistent monitoring and adjustment of operational parameters.
This Data is necessary to achieve and maintain these stable levels, ensuring the overall effectiveness and sustainability of the refining process.
Data Sample 1: Interface & Mud Levels in a Well-Controlled Stable Tank.

Graph illustrates the relationship between tank depth and solids concentration.
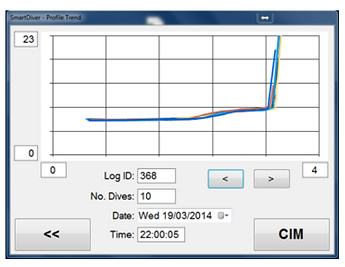
Comprises Data from 10 dives demonstrating measurement consistency as the Overlaid profiles showcase the reliability and precision of the measurement technique.
This Data provides insight into the vertical distribution of solids within the tank.
Data Sample 3: Solids vs Depth Tank Profile - Data from 10 Dives, demonstrating Repeatability.
The graph illustrates a critical period where the interface level surpasses the tank's upper limit, resulting in solids contamination of the overflow.
Concurrent changes in the mud level are depicted, showing instability during the loss of control. Followed by the re-establishment of proper control parameters, with both interface and mud levels returning to their optimal ranges.
This sample data serves as a case study for process upset conditions in thickener operations, highlighting the importance of vigilant monitoring and prompt corrective actions

Data Sample 2: Interface and Mud Level Fluctuations during a Control Loss Event.
Graph illustrates the relationship between Tank Depth and Solids Content.
There is minimal distinction between Interface and Mud layers, indicating a lack of clear Stratification. The Mud layer exhibits low density and minimal compaction. This suggests a relatively Homogeneous Mixture throughout the Tank's vertical profile.
By maintaining distinct mud and interface levels, thickener operations can achieve better separation efficiency, higher overflow clarity, optimized flocculant usage, and more stable and controllable processes overall.

Data Sample 4: Solids vs Depth Tank Profile - Mud & Interface Levels are almost the same.
SMARTDIVER® TRAINING
On request, PLA offers comprehensive on-site SmartDiver® Training for the Site's E&I Team. It covers specific Components, Fault-Finding and Troubleshooting.
Trainees receive detailed Training Materials and References, ensuring they are well-equipped for SmartDiver® Maintenance and Operations.
"10/10 – the Training took away the mystery.
...very appreciative of your efforts for the night shift training."


